06. Text: General Notes for Building Data Dashboards with Trina
Quick Note
The notes below are the general workflow for creating a dashboard. If you are ready to practice for yourself, feel free to skip ahead two concepts to the quiz and simply use this as a reference if you need it.
Dashboards
Dashboards are used to collect multiple sheets that exhibit one idea. For instance, here is an example of a dashboard about sales opportunities found in Salesforce data. You can see in the dashboard that clicking on one view filters the data on the other views. This is one of the excellent interactive features you can use to let viewers explore your data. Dashboards are also great for building reports from various views that you want to keep track of every day or week.
Tableau has a whole set of great dashboards in their gallery. Check them out for inspiration.
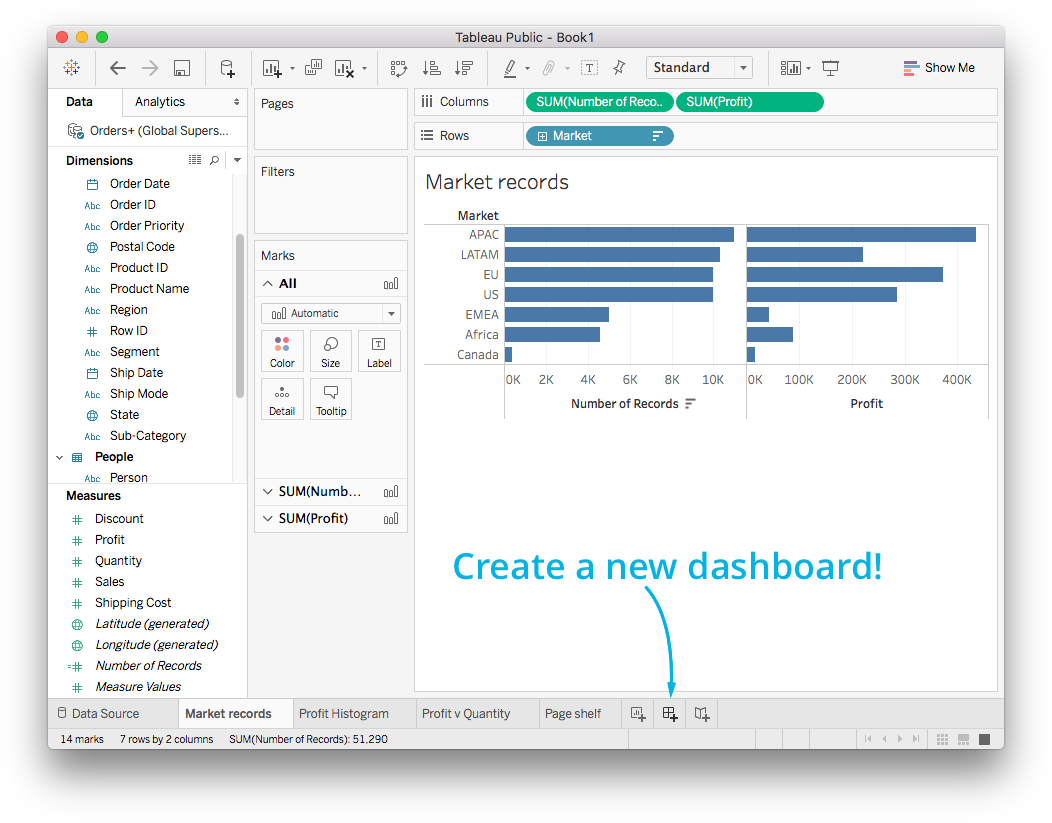
To create a new dashboard, click on the "New Dashboard" button in the bottom bar.

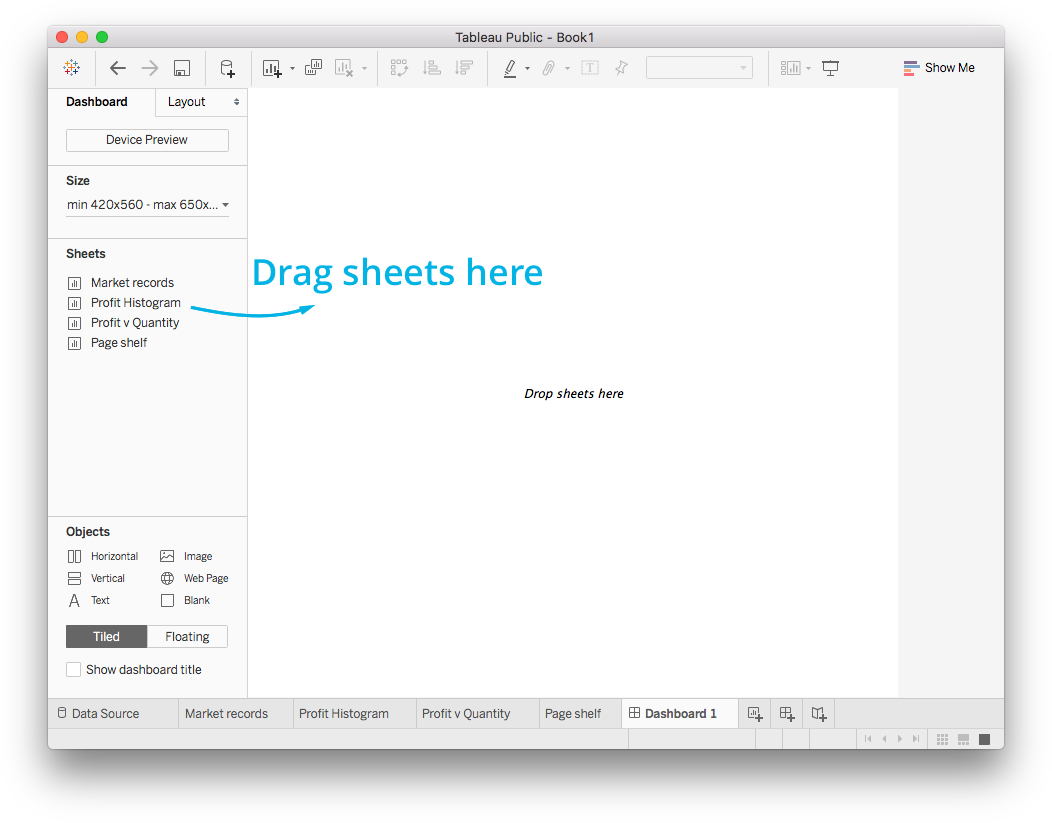
This brings on the dashboard interface. You create the dashboard by dragging sheets from the left bar into the canvas.

Tableau has a great set of tutorial videos on building dashboards if you want some additional information:
In the quiz on the next concept, you will get practice on your own building dashboards.